![]()
The MRiLab converts simulation parameters from configuration files into temporary
configuration structures during loading process, and uses these structures
to organize simulation workflow. The user can check default value of each
parameter by placing mouse cursor over selected parameter. The use can modify
simulation parameters for desirable simulation design, to make changes
effective, the user needs to press ‘Update’ button located under
‘Simulation Settings’ panel. The ‘Update’ button not only updates these
structures, but also performs a series of pre-scan processes including checking
incompatibility error and initializing other necessary simulation variables.
On the left of ‘Update’ button, there is a ‘Save’ button which saves updated
configuration structure back into configuration files for later use. One particular
case is that ‘CVs’ need to be updated and saved in order to make changes
effective. This is because ‘CVs’ is one part of the sequence file which needs to be
interpreted at the sequence waveform generation module. The sequence memo is also
provided at the ‘PSD Memo’ panel. It’s editable and can be saved using ‘Save’
button.
On the right of ‘Update’ button, there is a ‘Scan’ button which activates sequence
waveform generation, actual scan process and post-scan process including
image reconstruction and data saving. The MRiLab automatically detects
parameter changes and set ‘Scan’ button disabled. To enable ‘Scan’ button,
simply press ‘Update’ button. Notice that the update process may take some
time if heavy initialization is needed. The ‘Simulation Info Log’ is helpful
for checking log information about each simulation step. Once simulation
setting gets configured properly, the user can press ‘Scan’ button to start
scanning.
In MRiLab v1.3, batch scan is also provided. Instead of performing scan right
after configuration, the user can choose to snapshot current configuration in batch
basket by pressing ‘basket’ button on the right side of ‘Scan’ button. To view queued
scans, the user can press ‘BatchSim’ toolbar icon
The BatchSim panel (Figure 4.2) gives a list of queued scan tasks, the user can move the order of these scans, delete queued scans and execute them all in one click. The output folder is also adjustable.

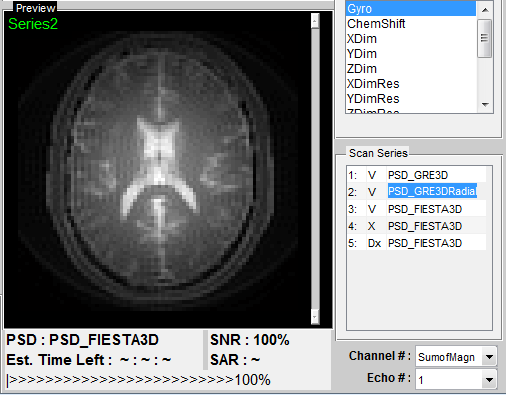
Figure 4.3 demonstrates an example of a series of simulation operated with different sequences. Each sequence is labeled with an unique series number, and shows in the list at ‘Scan Series’ panel. This series number is also a reference id for saved image and data in the output database (further explain in Chapter 5). There is also a status label on the left of each sequence name. The status labels include:
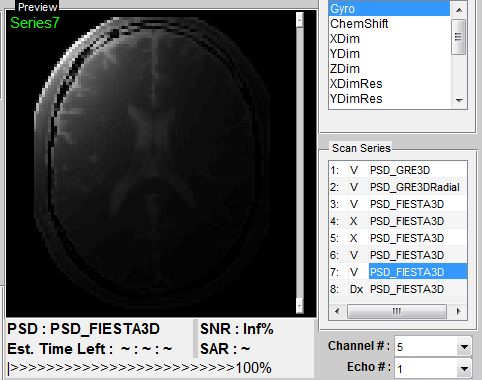
The example (Figure 4.3) shows a series of successful simulation by using PSD_GRE3D, PSD_GRE3DRadial and PSD_FIESTA3D sequences, as well as an incomplete simulation using PSD_FIESTA3D at the second time. The preview axes displays an image preview for series 2 simulated using PSD_GRE3DRadial sequence. The user can switch previews for successful simulation by clicking scan series item. Moreover, the series name is also editable. In this example the series name is kept the same as sequence name, which is not absolutely necessary. If the multiple channel coil for multiple receiving is performed (Figure 4.4), the user can specify display image to a single channel with ‘Channel #’ pop-up menu, or choose ‘SumofMagn’ for summation of image magnitude of all channels or ‘SumofCplx’ for summation of complex image of all channels. If multiple echo is enabled in the sequence, the user can also specify display image to any echo with ‘Echo #’ pop-up menu. Default value of 1 is used for single echo. The preview image provides a quick overview of the simulated images, a further image analysis can be performed with image display and analysis tools in Chapter 6.

At the bottom of the preview axes, there are information for the sequence name, estimated remaining scan time in real time and a scan progress bar. A global relative Signal-to-Noise Ratio (SNR) is also provided and automatic updated in real time. The relative SNR is defined as the ratio of current SNR to the initial SNR calculated upon loading the sequence. The SNR value is calculated using Equation 4.1.
|
| (4.1) |
where
|
| (4.2) |
To simulate image noise, MRiLab performs a noise adding process to acquired k-space data. The Gaussian noise with zero mean and user-defined standard deviation is added to the complex signal. The standard deviation is determined using Equation 4.3. If no noise is desired, the user can set ‘NoiseLevel’ to zero to get infinite SNR.
|
| (4.3) |
where these reference values are given as:
|
| (4.4) |